Blog
Product updates, guides and ideas on making engineering clear to the business.
Product Updates
Fewer messages, better ones: Introducing our new notifications engine
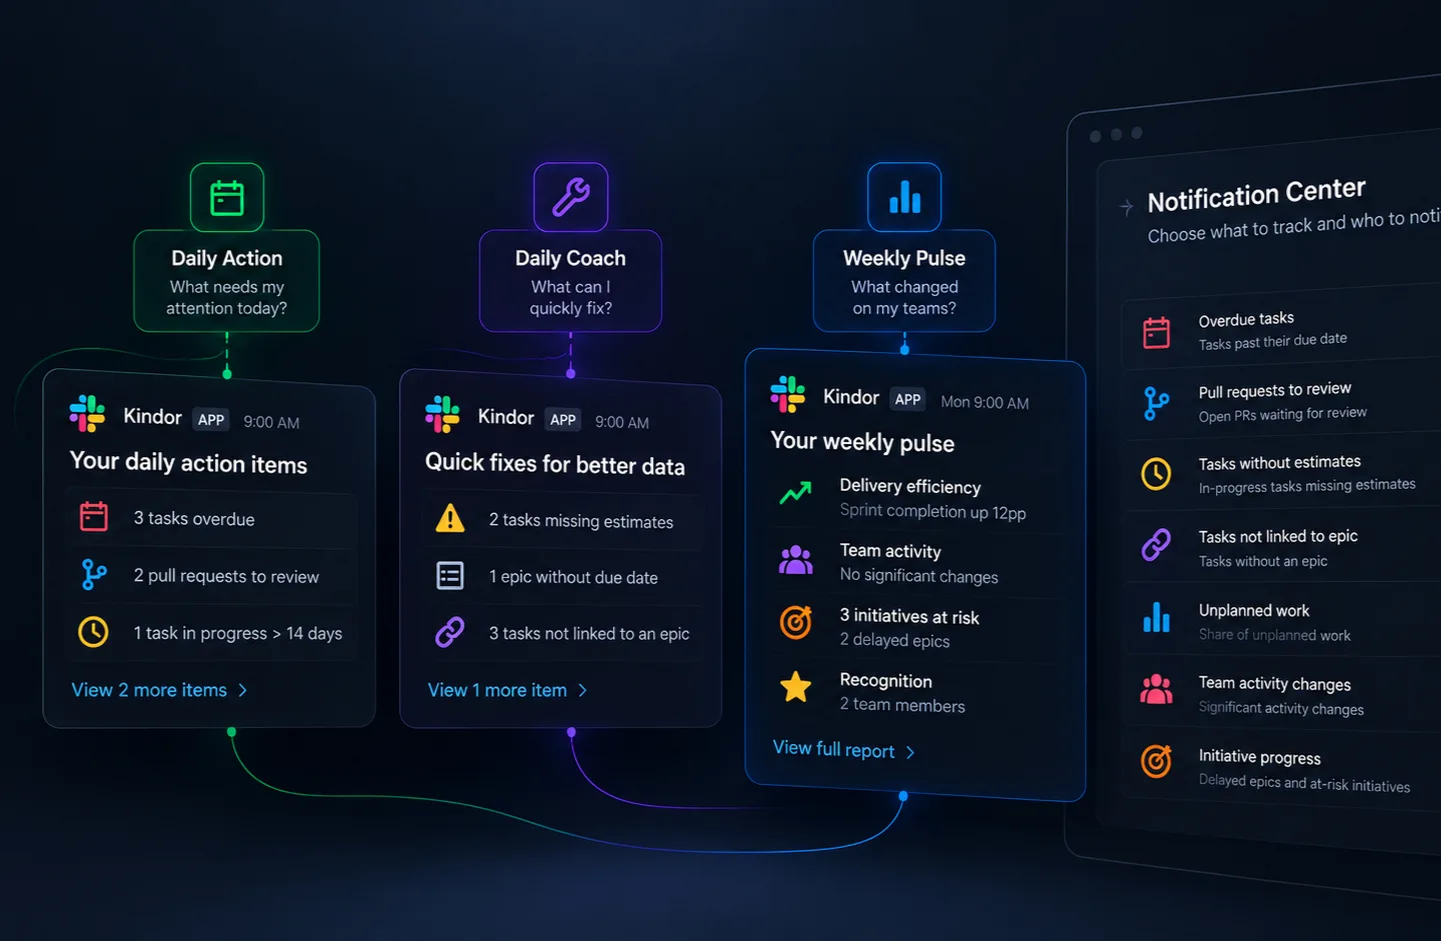
Most engineering leaders have the same complaint about alerts: there are too many of them, and they arrive without context.Today we are rebuilding how Kindor keeps you informed. Instead of one message per warning, Kindor now sends short digests, each written for a specific reader, and gives admins a single place to control them.Three digests, three questionsDaily Action answers "What needs my attention today?" Each weekday, contributors get one short list of their own work that needs a nudge: ta
Product Updates
Introducing Claude Code Analytics in Kindor
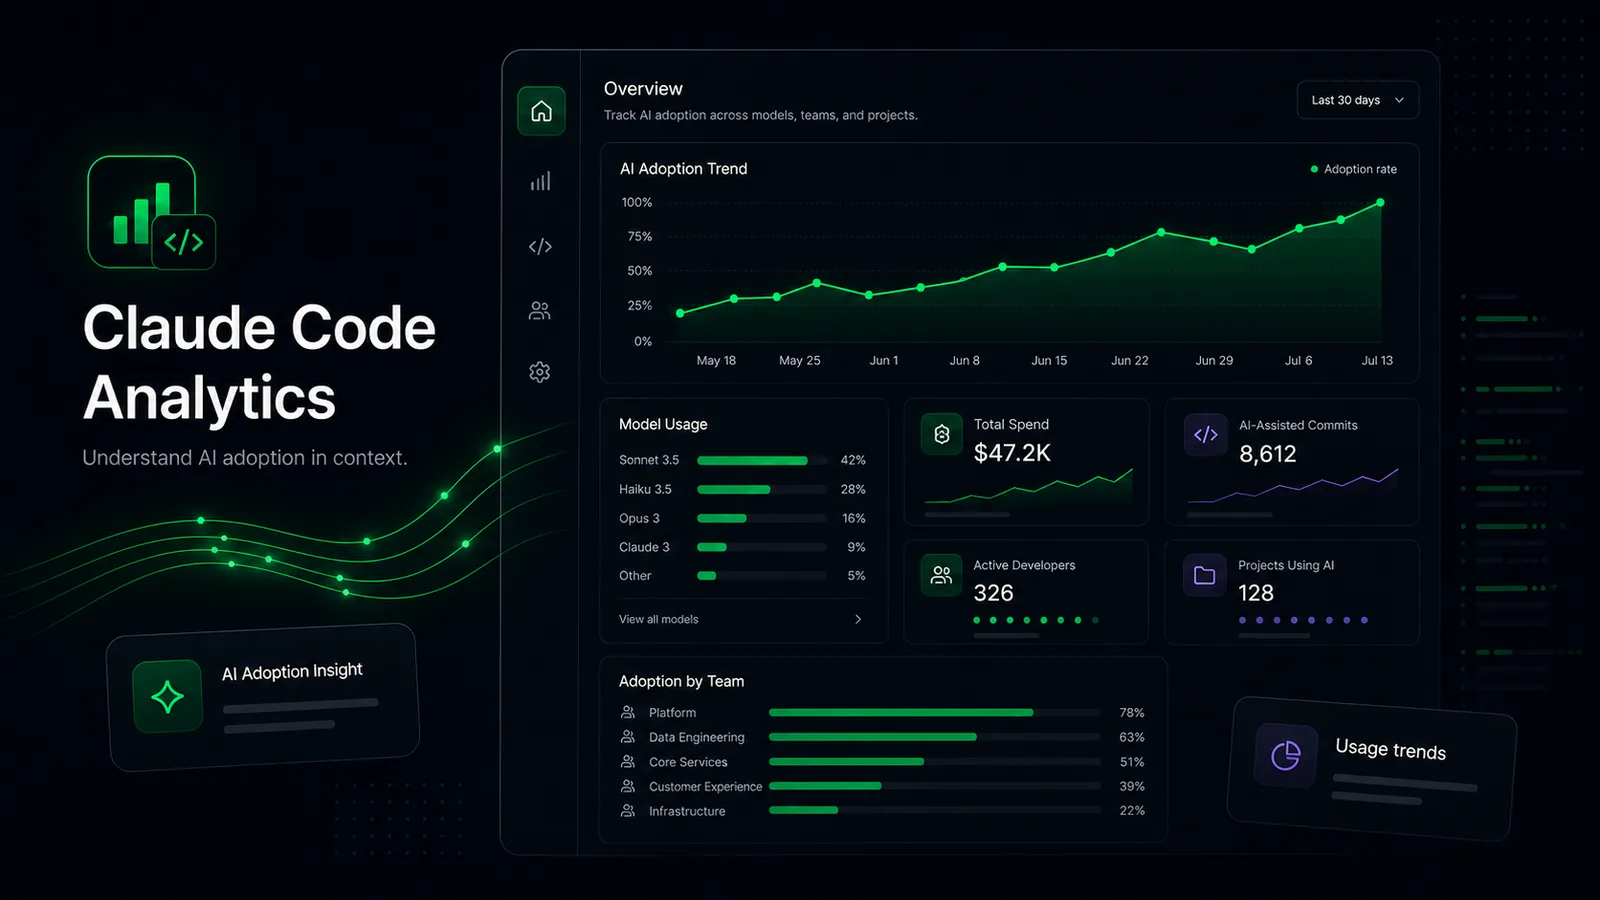
Engineering teams are adopting AI coding tools quickly. The harder question is no longer whether a tool is available - it is how it is being used across the organization, what it costs, and how that usage connects to the work teams deliver.Today, we are introducing Claude Code Analytics in Kindor.The new integration brings Claude Code usage into the same view as the contributors, teams, commits, pull requests, and delivery metrics you already use in Kindor. It gives engineering leaders a privacy
Engineering Excellence
When Software Gets Cheaper, Focus Matters More
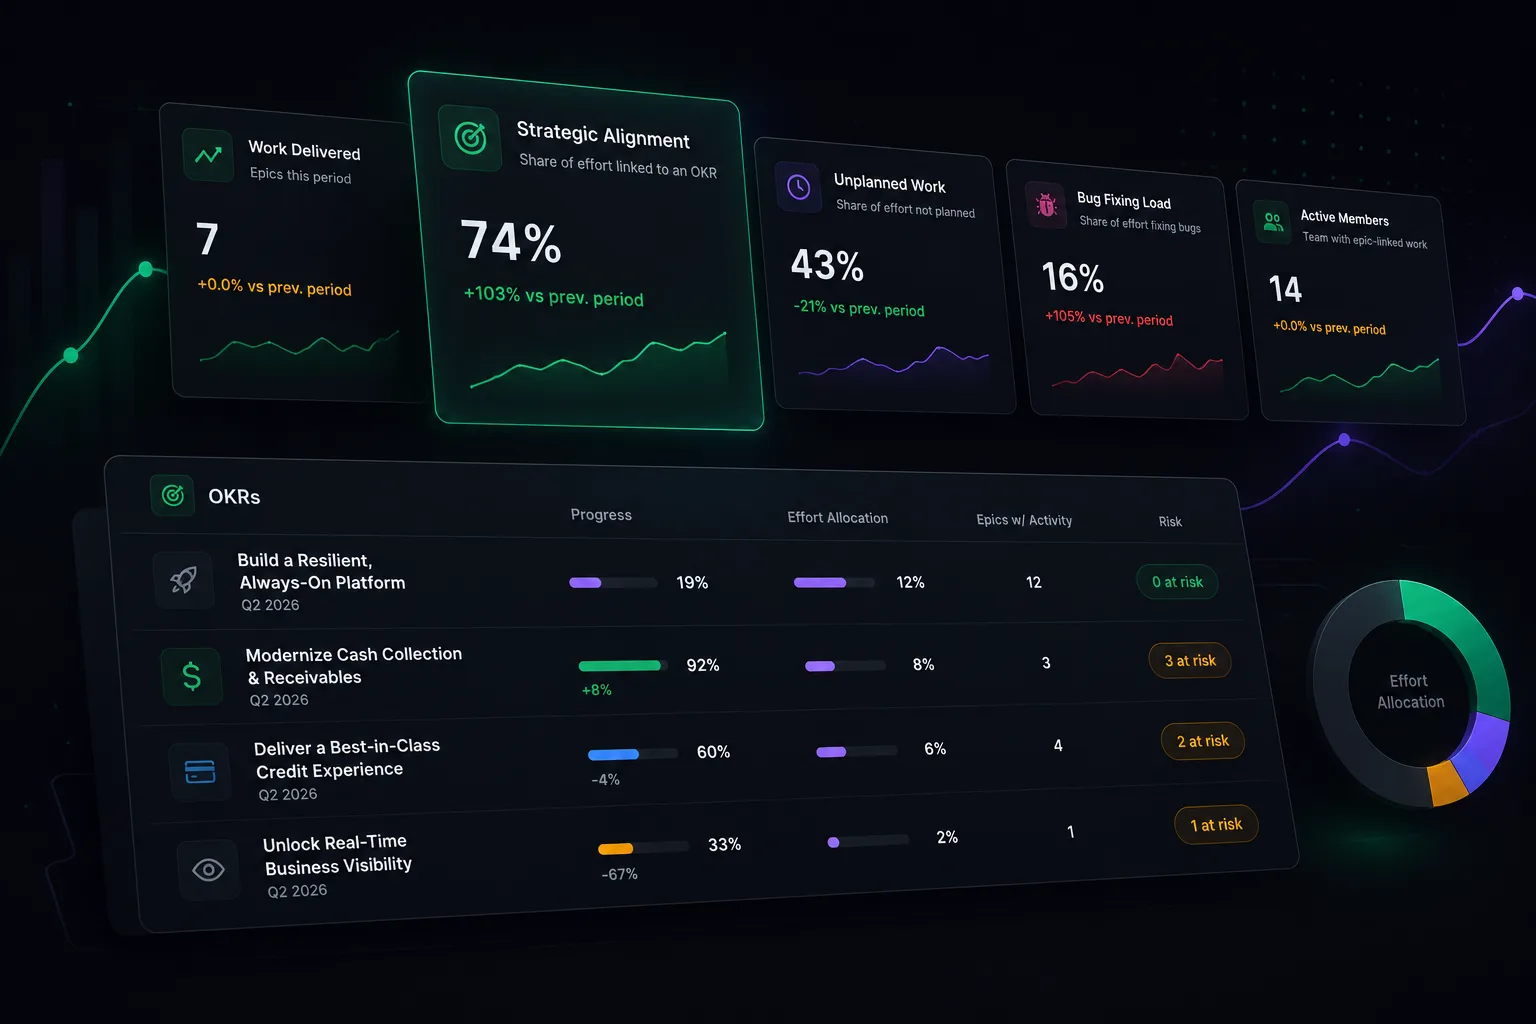
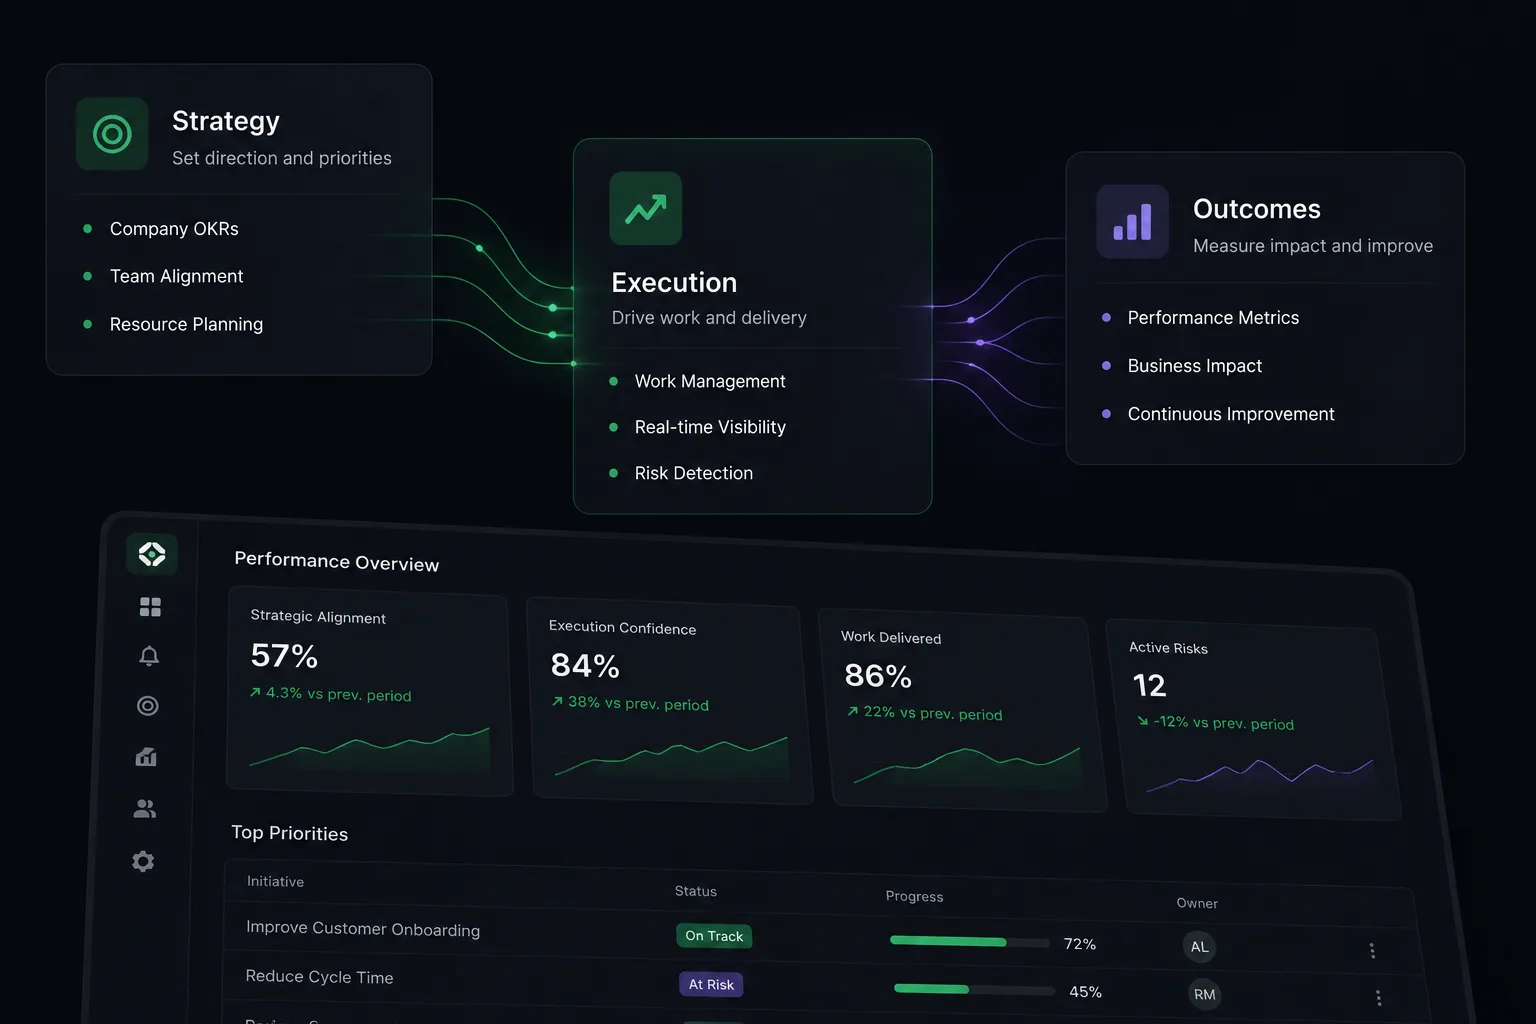
AI is changing how quickly teams can ship. The next advantage is understanding where engineering effort creates meaningful strategic progress.
Product Updates
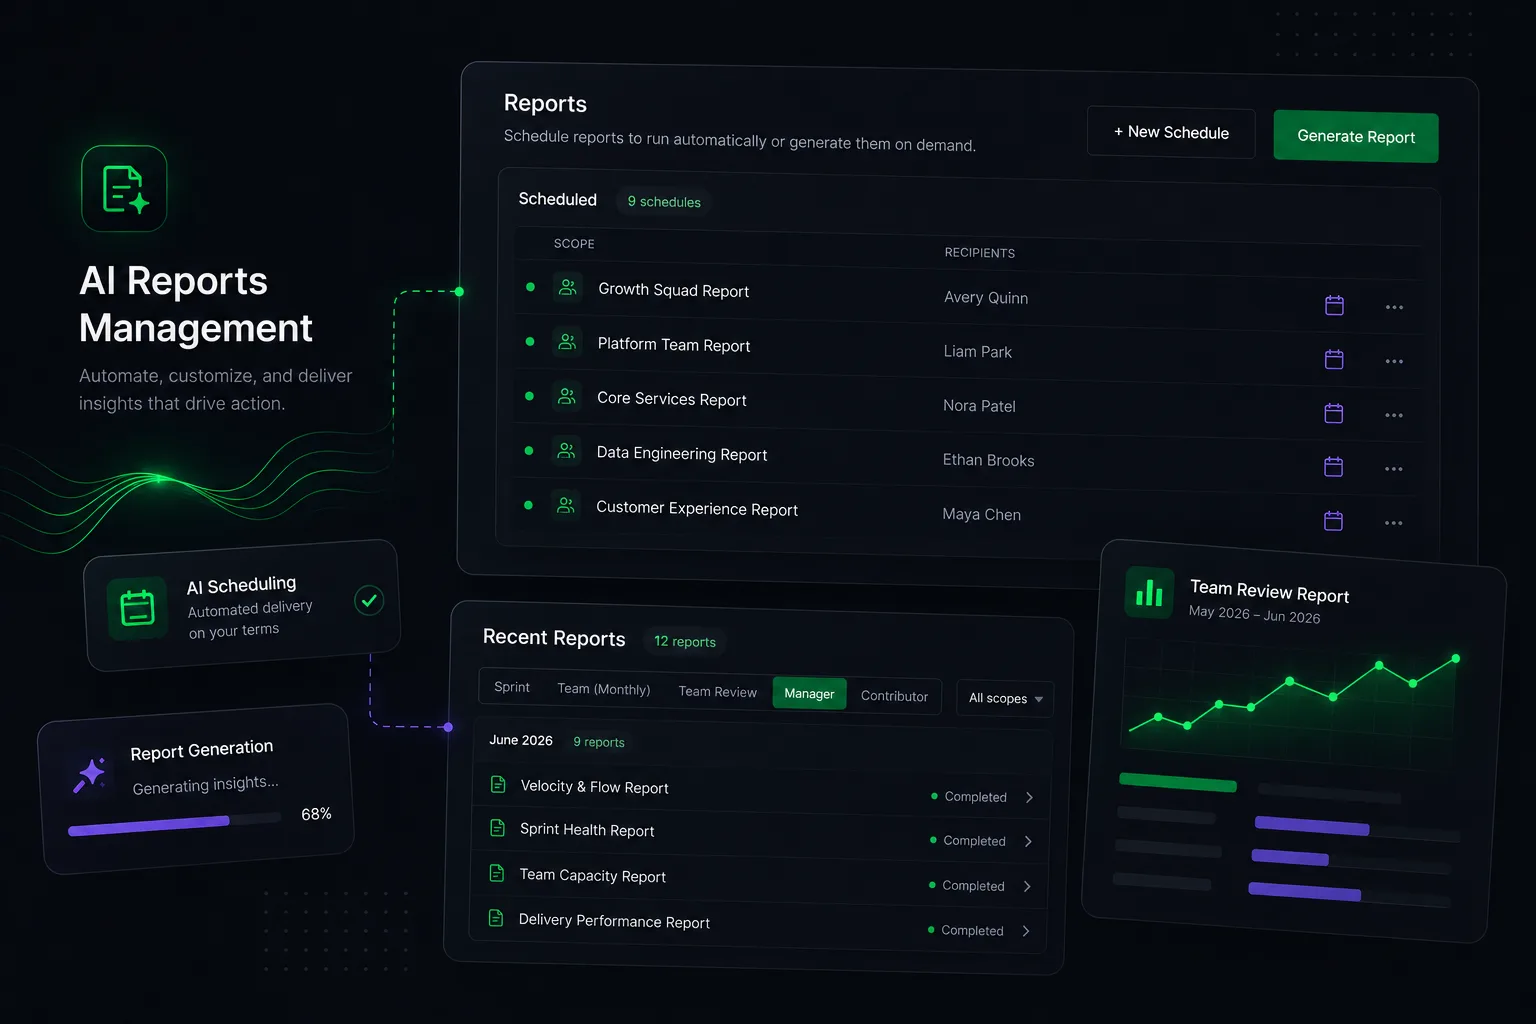
Introducing AI Reports Management
Kindor already supported automated operational reports, helping engineering organizations receive recurring sprint and monthly summaries directly via email.However, organizations could not yet configure report schedules, generate reports on demand, or browse previously generated reports.Today, we’re introducing a new Reports Management experience in Kindor that brings these capabilities into the product through a centralized self-service interface.With this new module, organizations can now: • C
Product Updates
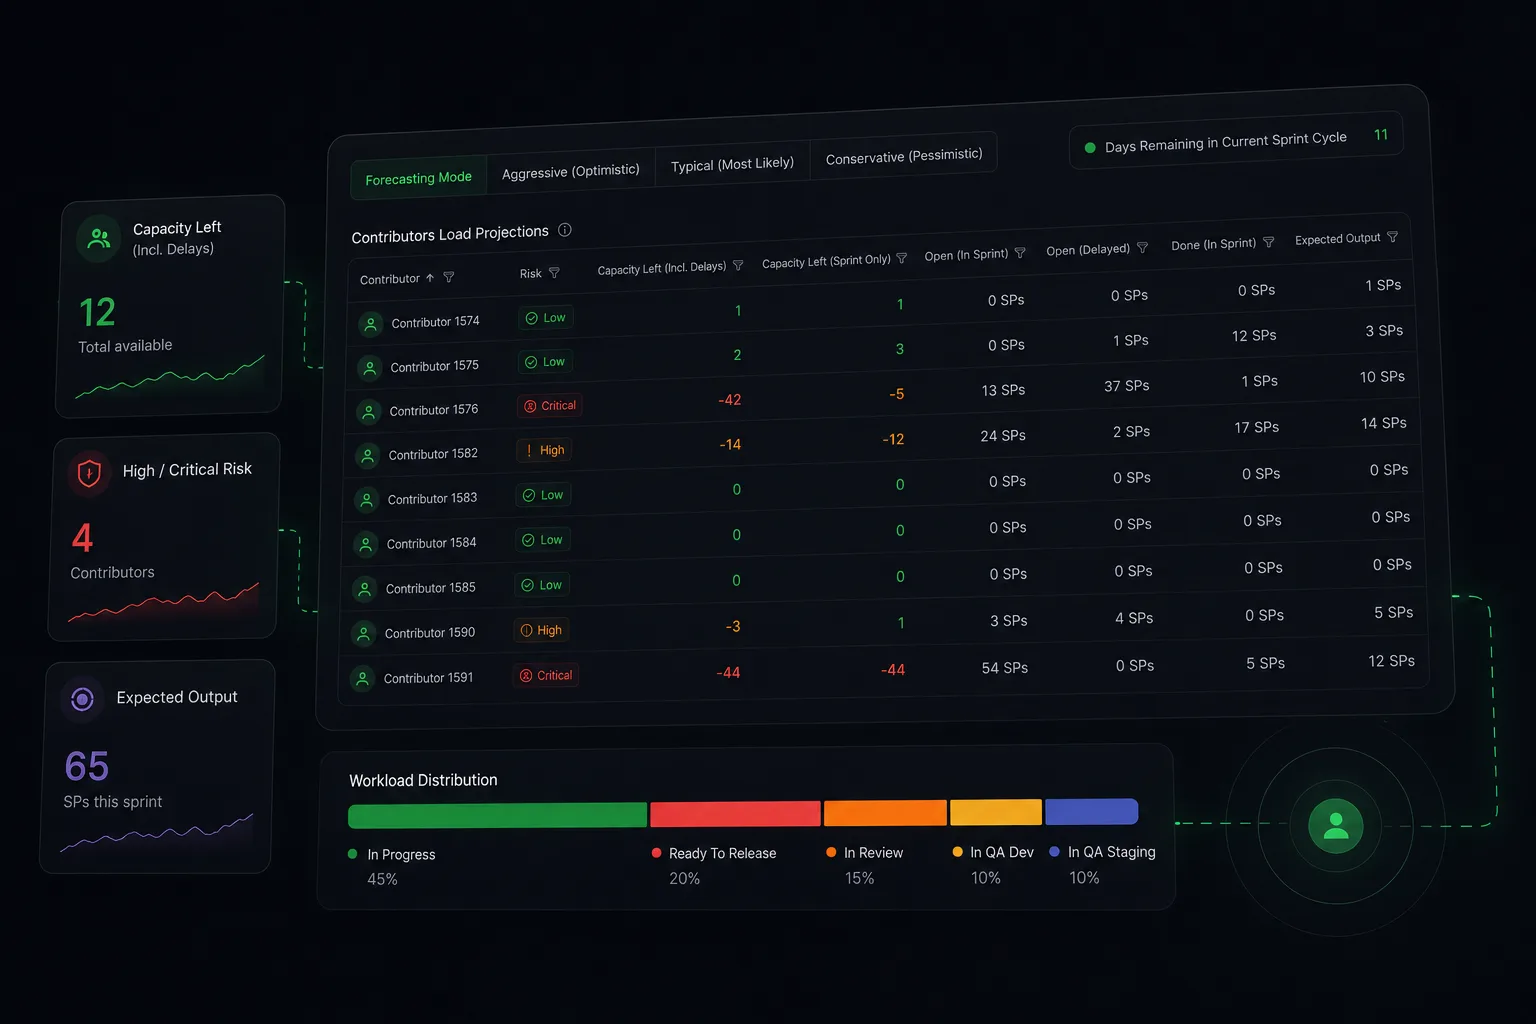
Introducing the Contributors Capacity and Workload Dashboard
A New and Easy Way to Plan and Forecast Sprint Workload
Product Updates
Kindor New Experience 2025
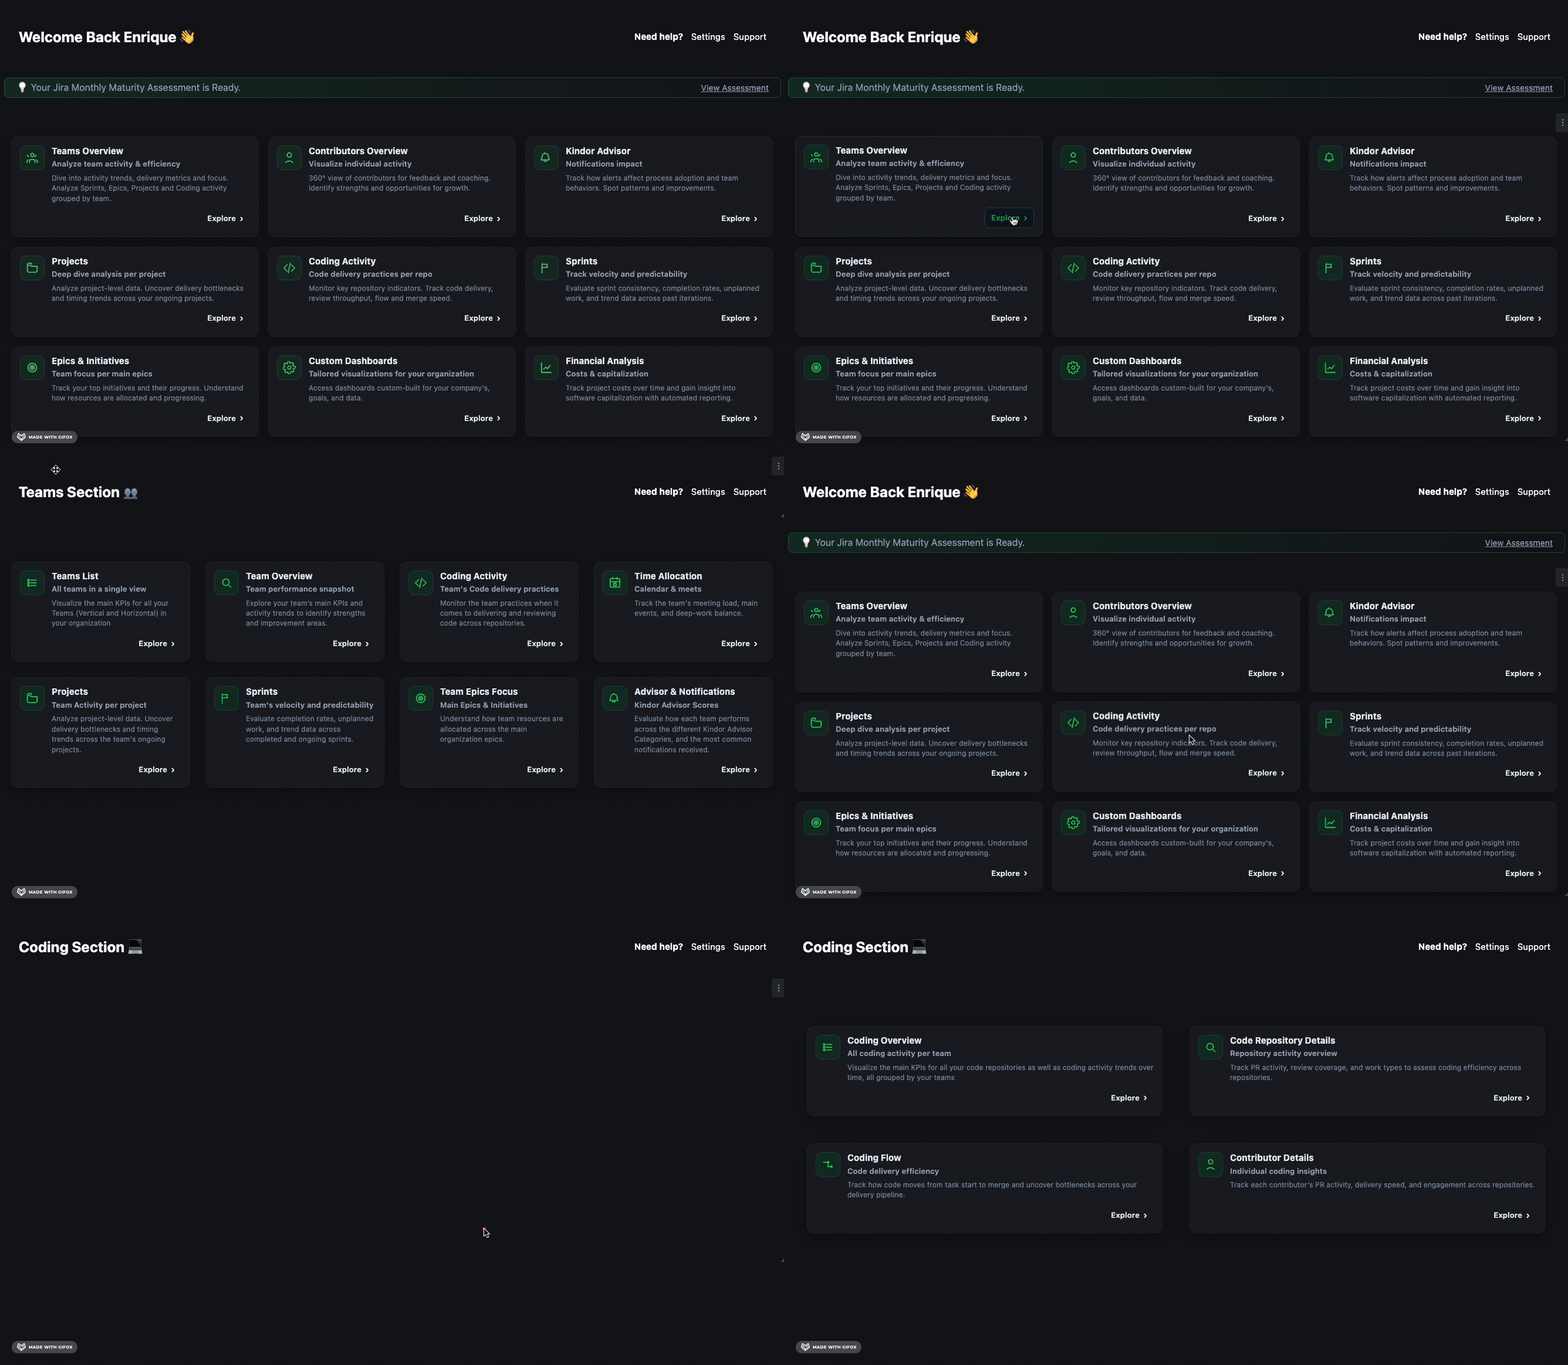
Discover the new Kindor experience. In this post, we’ll walk you through what’s new to help you make the most of the product. New Navigation ExperienceThis new version of Kindor was designed to make navigation smoother and understanding your metrics easier than ever.🏠 New Homes for Each SectionWe’ve kept almost the same sections as before, but previously, entering a section took you straight into a dashboard, which sometimes made it unclear what other dashboards were available. Now, each sectio
Product Updates
🚀 What’s New at Kindor – July 2025 Updates
AI-Powered Monthly Reports, Jira Releases & More
Product Updates
Kindor Scores: Unlock a Clearer View of Engineering Contributions
Over the past few months, we’ve been focused on a single question:How can we help leaders truly understand where engineers excel and where there’s room to grow?Today, we’re excited to introduce Kindor Scores, a new set of multidimensional indicators designed to give you a clear, data-backed view of each contributor’s impact.These scores are calculated monthly, based on real activity. Each one highlights a different facet of engineering work—helping you identify strengths, monitor progress, and s
Guides & Tutorials
Using Kindor to understand how your engineers compare to others
Introducing Contribution Scores and Individual BenchmarkingOver the past few months, we’ve focused on one recurring question from tech leaders:“How do I really know if my engineers are doing well?”You might be tracking PRs, tasks, or even sprint completion. But eventually, someone asks: • “Is this good?” • “How does this compare to others?” • “Are we overstaffed?” • “Should this person get a promotion?” • “Why do other companies seem to deliver more with fewer people?” These are fair questions
Product Updates
🚀 What’s New at Kindor – June 2025 Updates
Kindor Scores, Org Chart View and other exciting updates!
Product Updates
🚀 What’s New at Kindor – May 2025 Updates
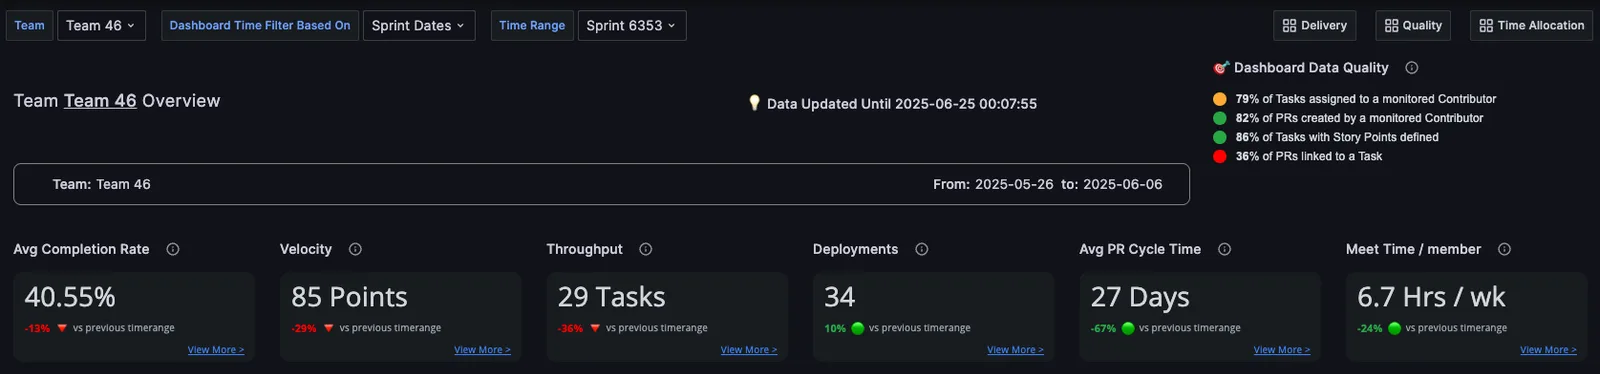
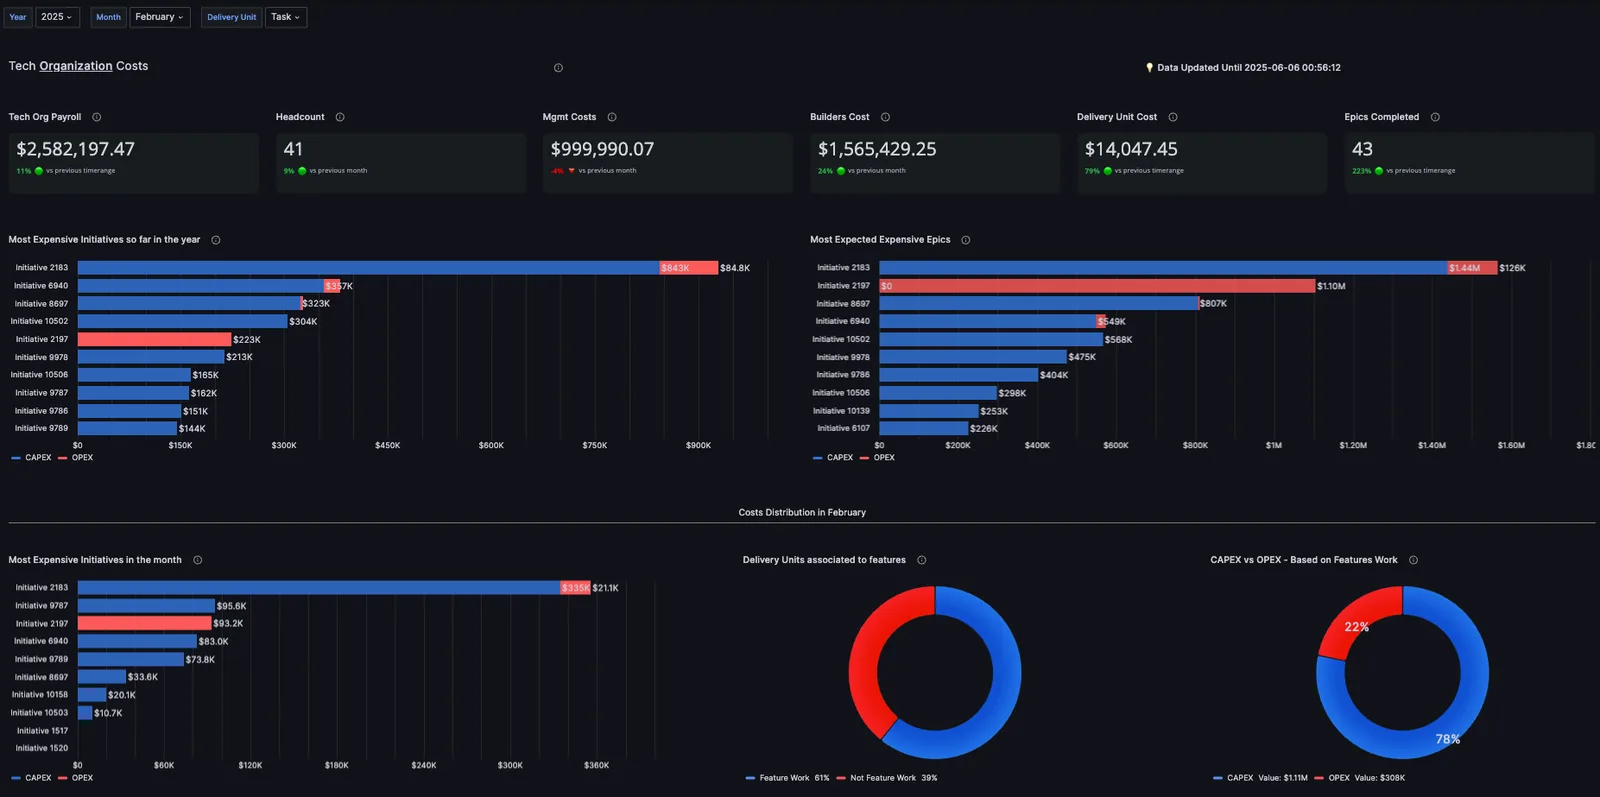
At Kindor, we’re constantly listening to our users and improving the way you understand your tech organization’s performance. This month, we focused on making your dashboards more insightful, intuitive, and actionable, helping you dig deeper into your team’s delivery, time allocation, and individual contributor patterns.From smarter delivery and quality tracking to enhanced time analytics and new visualizations in the contributor section, here’s everything that’s new (and what’s coming soon!).
Engineering Excellence
Using Kindor to answer engineering productivity questions (Part 1)
See how Kindor, through practical use cases, can help you answer multiple productivity questions aroud your tech team.
Engineering Excellence
10 Signs Your Engineering Team Needs Better Analytics
Identify the key signs that your engineering team needs better analytics to improve performance, productivity, and alignment with business goals.
Engineering Excellence
Engineering Team Performance: Common Issues and Solutions
Explore common challenges in engineering team performance and effective solutions to enhance communication, set clear goals, and optimize workflows.
Engineering Excellence
5 Ways to Improve Sprint Velocity Using Data Analytics
Explore five data-driven strategies to enhance your team's sprint velocity and improve overall productivity in agile development.
Engineering Excellence
Engineering Analytics vs Traditional KPIs: What to Choose
Explore the differences between engineering analytics and traditional KPIs to enhance your team's performance and strategic alignment.
Engineering Excellence
How to Measure Developer Productivity: A Complete Guide
Explore effective strategies to measure developer productivity, combining metrics and feedback to enhance team performance and business outcomes.
Engineering Excellence
7 Key Metrics Every Engineering Manager Should Track
Explore seven essential metrics that engineering managers should track to enhance team performance and align with business objectives.
Engineering Excellence
Unlocking Developer Potential with the SPACE Framework
What it is, why it matters and how to get started.
Engineering Excellence
How Epics Drive Alignment, Productivity, and Business Value
Why should your organization start using Epics and how can you get started?
Guides & Tutorials
Microsoft Teams Integration
Connecting Kindor to Microsoft Teams with OAuth 2.0: A Step-by-Step Guide
Guides & Tutorials
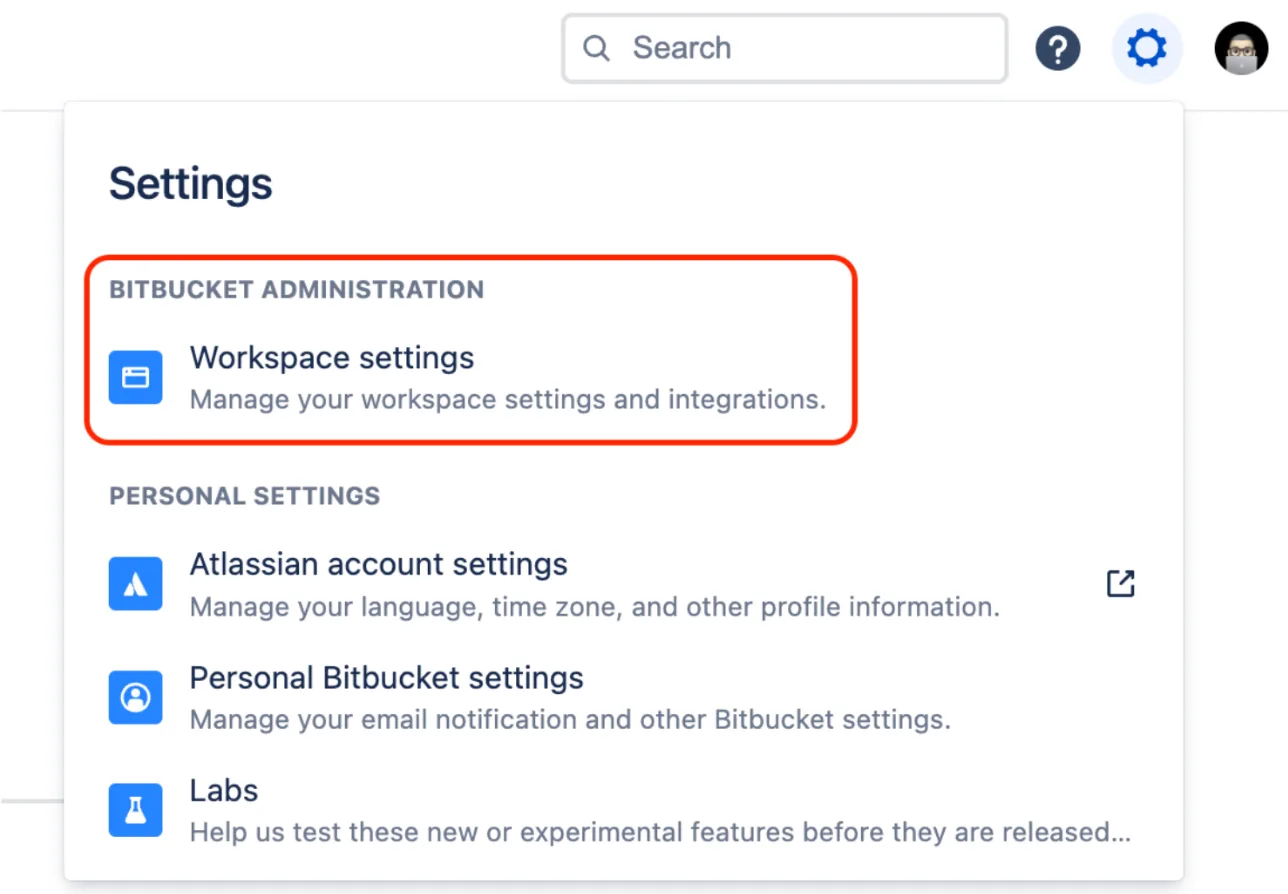
Atlassian Bitbucket Integration
Easily & securely connect Kindor to Atlassian Bitbucket through OAuth 2.0
Guides & Tutorials
Github Integration
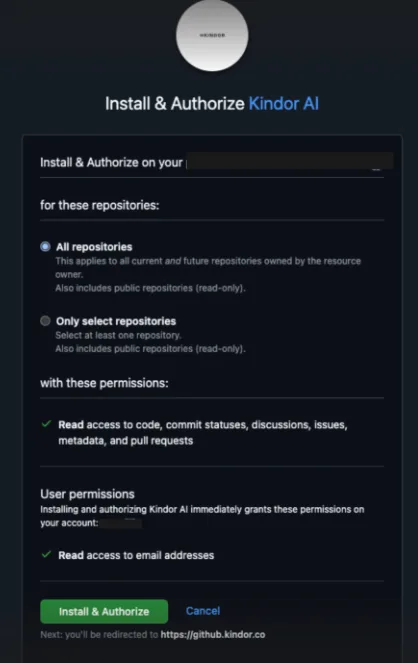
Integrate your Github organization by installing Kindor's Github App
Engineering Excellence
Incident Management
How an Incident Management process will help your organization improve over time and give peace of mind to your customers
Engineering Excellence
DORA Metrics
DORA Metrics, what they are, why they matter and how to implement them in your organization
Guides & Tutorials
Atlassian Jira Integration
Easily & securely connect Kindor to Jira using a Personal Access Token.
Guides & Tutorials
GitLab Integration
This article explains the steps to follow to connect your GitLab account to Kindor.
Guides & Tutorials
Google Workspace Integration
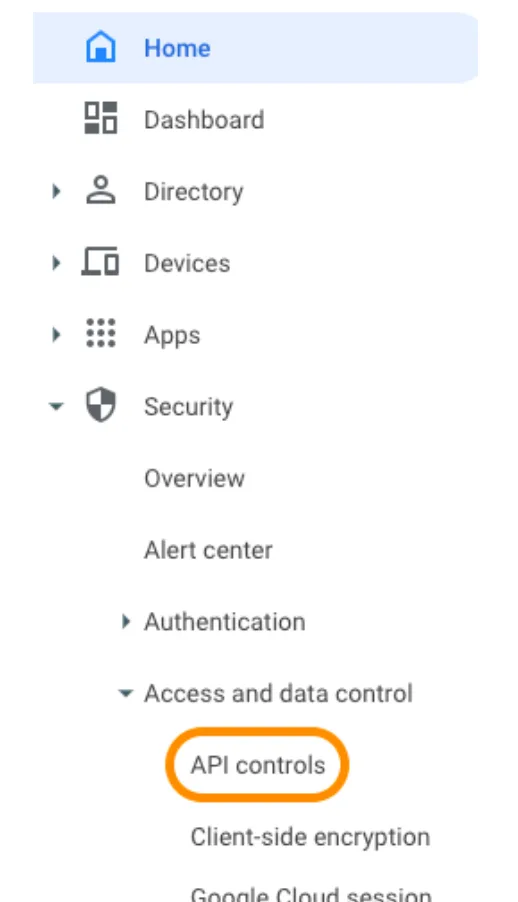
This article explains the steps to follow to connect Google Calendar and Google Meet to Kindor
Guides & Tutorials
Metrics Glossary: Get an overview of what each metric in Kindor means
The following article explains all the metrics you can find in our product and how to use them to potentiate your engineering teams.*Pull Request and Merge Request mean the same thing (Pull Requests are used in GitHub and Bitbucket and Merge Requests in Gitlab). In this document, we will use the term Pull Request or PR to refer to both concepts.Table of Contents:Coding Details Metrics • Commits • Additions • Deletions • Pull Requests Opened • Pull Requests Merged • Pull Requests Merged By
Guides & Tutorials
Team Structure: How to Define It for Your Different Technology Teams at Kindor
Optimize team structure in Kindor with vertical and horizontal groupings for better productivity and insights.